At the Race Across America (RAAM), an official GPS and satellite-based tracking system was used to monitor riders’ movements in real time. From the feedback I received from my fans, this made the race much easier, more engaging, and more exciting for spectators to follow.
From the Trackleaders page of RAAM 2025, I extracted the moving and stopped times of the first six finishers and put them into the table below:
| Overall place | Moving time | Stopped time |
| 1. | 7d 21h 47m | 1d 0h 42m |
| 2. | 8d 12h 19m | 1d 0h 46m |
| 3. | 9d 1h 11m | 1d 16h 51m |
| 4. Rait Ratasepp | 8d 11h 22m | 2d 16h 0m |
| 5. | 8d 12h 43m | 2d 17h 38m |
| 6. | 8d 2h 35m | 3d 4h 54m |
My Moving Time and Device Glitches
Tracker Data
The tracking device recorded my moving time as 8 days, 11 hours, and 22 minutes. However, according to my Garmin Edge bike computer, the actual moving time was lower, with a correspondingly higher stopped time.
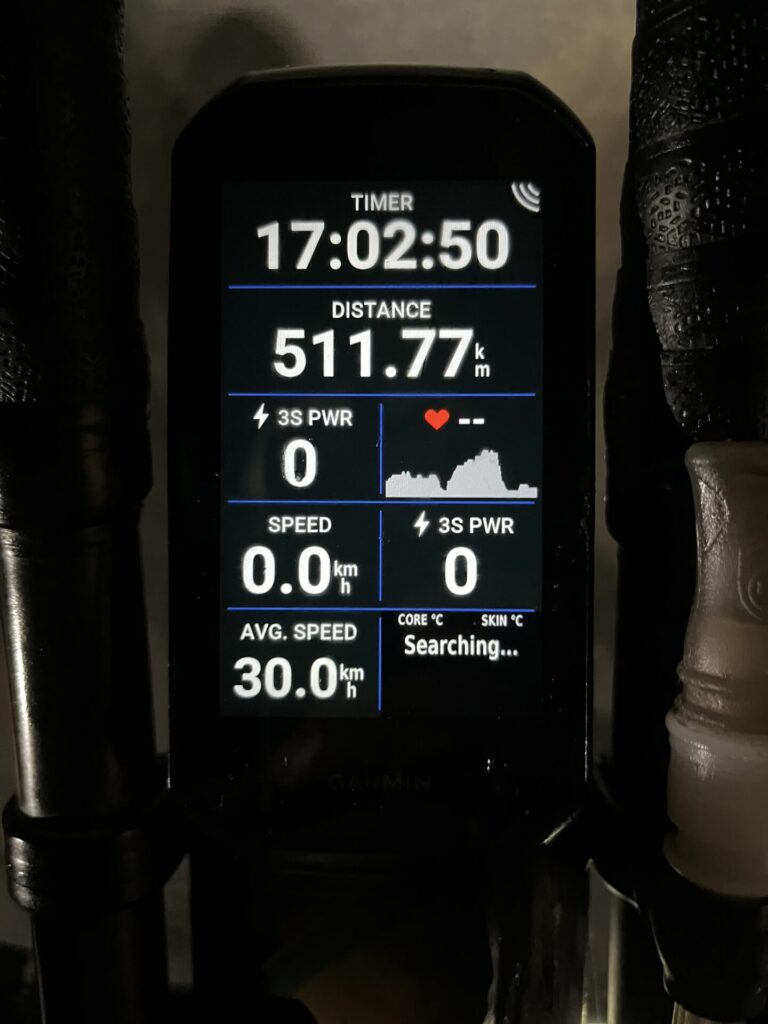
Photo: this photo was taken on day 6 of RAAM, showing the distance covered. The 17:02:50 visible on the screen is pure moving time
Loss of Connection
Those who followed my race know that at some point the tracker lost connection, and it took us a long time to notice and get it working again. The device had to be kept in a specific position and not placed next to a phone in a same jersey pocket. I believe my team and I followed these instructions when moving the device during clothing changes, but I cannot be 100% certain—fatigue and sleep deprivation make small mistakes inevitable.
Reliability of the Data
It’s likely that other riders also experienced device glitches, so I believe the numbers in the table are still fairly comparable. My logic also says that the stopped time shown in the table is the minimum possible. In other words, no rider’s actual stopped time can be lower than these numbers, which means the corresponding moving time is the maximum —when the device stopped recording, it counted as moving time (at least in my case). This approach is reasonable: although it makes the moving/stopped ratio less precise, it still reflects reality quite well. In practice, every RAAM rider spends the vast majority of their time on the bike, and even during tracker malfunctions, they are most likely riding.
Ultimately, it doesn’t matter if the tracker’s breakdown of moving vs. stopped time is accurate to the minute—the finish time and overall standings are not based on these numbers. The tracker’s primary and most important purpose is to make the race easy and engaging to follow in real time.
Conclusions
The table satets the fact that strong legs alone are not enough to win RAAM. Equally important is how skillfully a rider manages their stops and how they cope with extremely limited sleep.
For example, the first and sixth finishers had nearly the same moving time (a difference of only about 10 hours), but their stopped times differed by more than two full days. Or take the third-place finisher: he spent the most time moving, but his shorter stopped time still secured him a podium place.
👉 The secret to success in RAAM lies in solving your own personal equation: how to minimize sleep and stopped time without becoming significantly slower on the bike, and without turning saved time into a net loss.
Time Lost Due to Breathing Issues
Analyzing the Data
My Garmin Edge computer tracked not only total time but also moving and stopped times separately. This information is invaluable for analyzing performance afterwards.
Loss in the First Half
By comparing my moving vs. stopped time ratio from the first 1,324 km (excluding a powernaps in motels) with the following 706 km, I calculated that I lost 12 hours and 17 minutes in the first 2,052 km due to breathing problems and an ER visit. Of this, 9 hours 49 minutes was additional stopped time caused by frequent pauses during that 706 km stretch.
Impact on Power
The breathing problems didn’t just force me to stop more often—they also slowed me down while riding. My normalized power dropped by 19 watts compared to the earlier 1,324 km section. Had I maintained that higher power, I would have covered 777 km in the same time instead of 706 km—71 km more, which translates to about 2 hours and 28 minutes gained at my average race speed.
Final Day
On the last day, I lost even more time due to repeated “power naps” needed to fight indescribable sleepiness. This showed clearly in the data: for the final 326 km, my moving/stopped ratio was 70/30, while for the preceding 2,500 km it was 84/16. Applying the same 84/16 ratio to the last stretch reveals I lost at least another 3 hours and 17 minutes.
Total Loss
Had I avoided the earlier 12h17m loss, I would almost certainly have finished before the severe sleep struggle of the final hours. In total, I estimate that breathing-related problems cost me at least 15 hours and 34 minutes.
Fortunately, thanks to medical investigations I now know the cause of these problems and believe I can either fully prevent them next time or quickly bring them under control. I’ll write separately about the diagnosis, treatment, and root causes.
Side Effects of the Breathing Problems
Nerve Damage
Breathing difficulties didn’t just cause a loss of time—they also contributed to the damage to the median nerve in my left hand. A time trial bike is most comfortable in the aero position — that’s exactly what it’s designed for — but while struggling with breathing issues, I was forced to ride for long stretches in an upright position, holding onto the base bar. Unlike a regular road bike, the base bar of a triathlon bike is not meant to be held onto for extremely long periods, which makes this riding position quickly uncomfortable, places the arm in an unnatural position, and puts a great deal of pressure on the wrists.
By comparison, during training and previous endurance challenges I have spent countless kilometres over consecutive days on the bike without ever experiencing nerve-related issues, simply because I was able to remain mostly in the aero position. Therefore, I had no reason to anticipate or fear the possibility of nerve damage during RAAM.
After the race, when delving deeper into this topic and asking other RAAM participants about their experiences, I got the impression that the same problem affects RAAM participants quite often. That is why I was somewhat surprised that before the start I never came across anyone addressing this topic – even though I had asked others directly about their experiences, read several books, and watched countless videos and documentaries on YouTube. If anyone were to ask me about my RAAM experience, then numb and tingling fingers (the way this injury manifests itself) would definitely be one of the key issues I would highlight, since recovery from it has turned out to be the most time-consuming.
One might think that only thousands of kilometers of nonstop pedaling could put the body to such a test. In reality, however, the same nerve injury can be caused much more easily – for example, simply by working for long periods with a computer mouse or keyboard, forcing the wrist into an unnatural position. To my surprise, it turned out that doctors and physiotherapists actually see mostly patients with exactly that kind of problem :).
Saddle Problems
Another issue was saddle discomfort. In the aero position, much of the body weight rests on the elbows, but once out of that position, the pressure shifted to the saddle. From the fifth day on, I had to use extra padding from time to time.
Lesson Learned
This is a clear example of how one problem can trigger several others. I had ridden very long distances on a triathlon bike before without ever experiencing nerve issues, so I didn’t anticipate it and had no preventive measures in place.
Interesting Numbers from RAAM
- According to my Garmin Edge, I pedaled a total of 4,947 km during RAAM.
- Total climbing: 37,479 meters.
- Average speed (based on moving time only, excluding stops and sleep): 28.73 km/h.